
Seed non-destructive intelligent detection technology: A review of current status, advances, and future directions
1 Introduction
Conventional seed quality assessment methods, including tetrazolium testing, germination assays, and biochemical analyses, have long been the foundation of seed science. Although reliable, they are destructive, time-consuming, labor-intensive, and often subject to human interpretation. These limitations have driven a recent shift toward non-destructive approaches. In particular, the integration of high-throughput phenotyping techniques such as hyperspectral imaging (HSI), multispectral imaging (MSI), and X-ray imaging with advances in artificial intelligence (AI), especially deep learning, has ushered in a new era of seed quality inspection.
2 Overview of non-destructive detection of seeds
The study conceptualizes the overall system into three primary modules: input (detection methods), model (processing algorithms), and output (detection tasks), forming a standardized Input-Model-Output architecture.
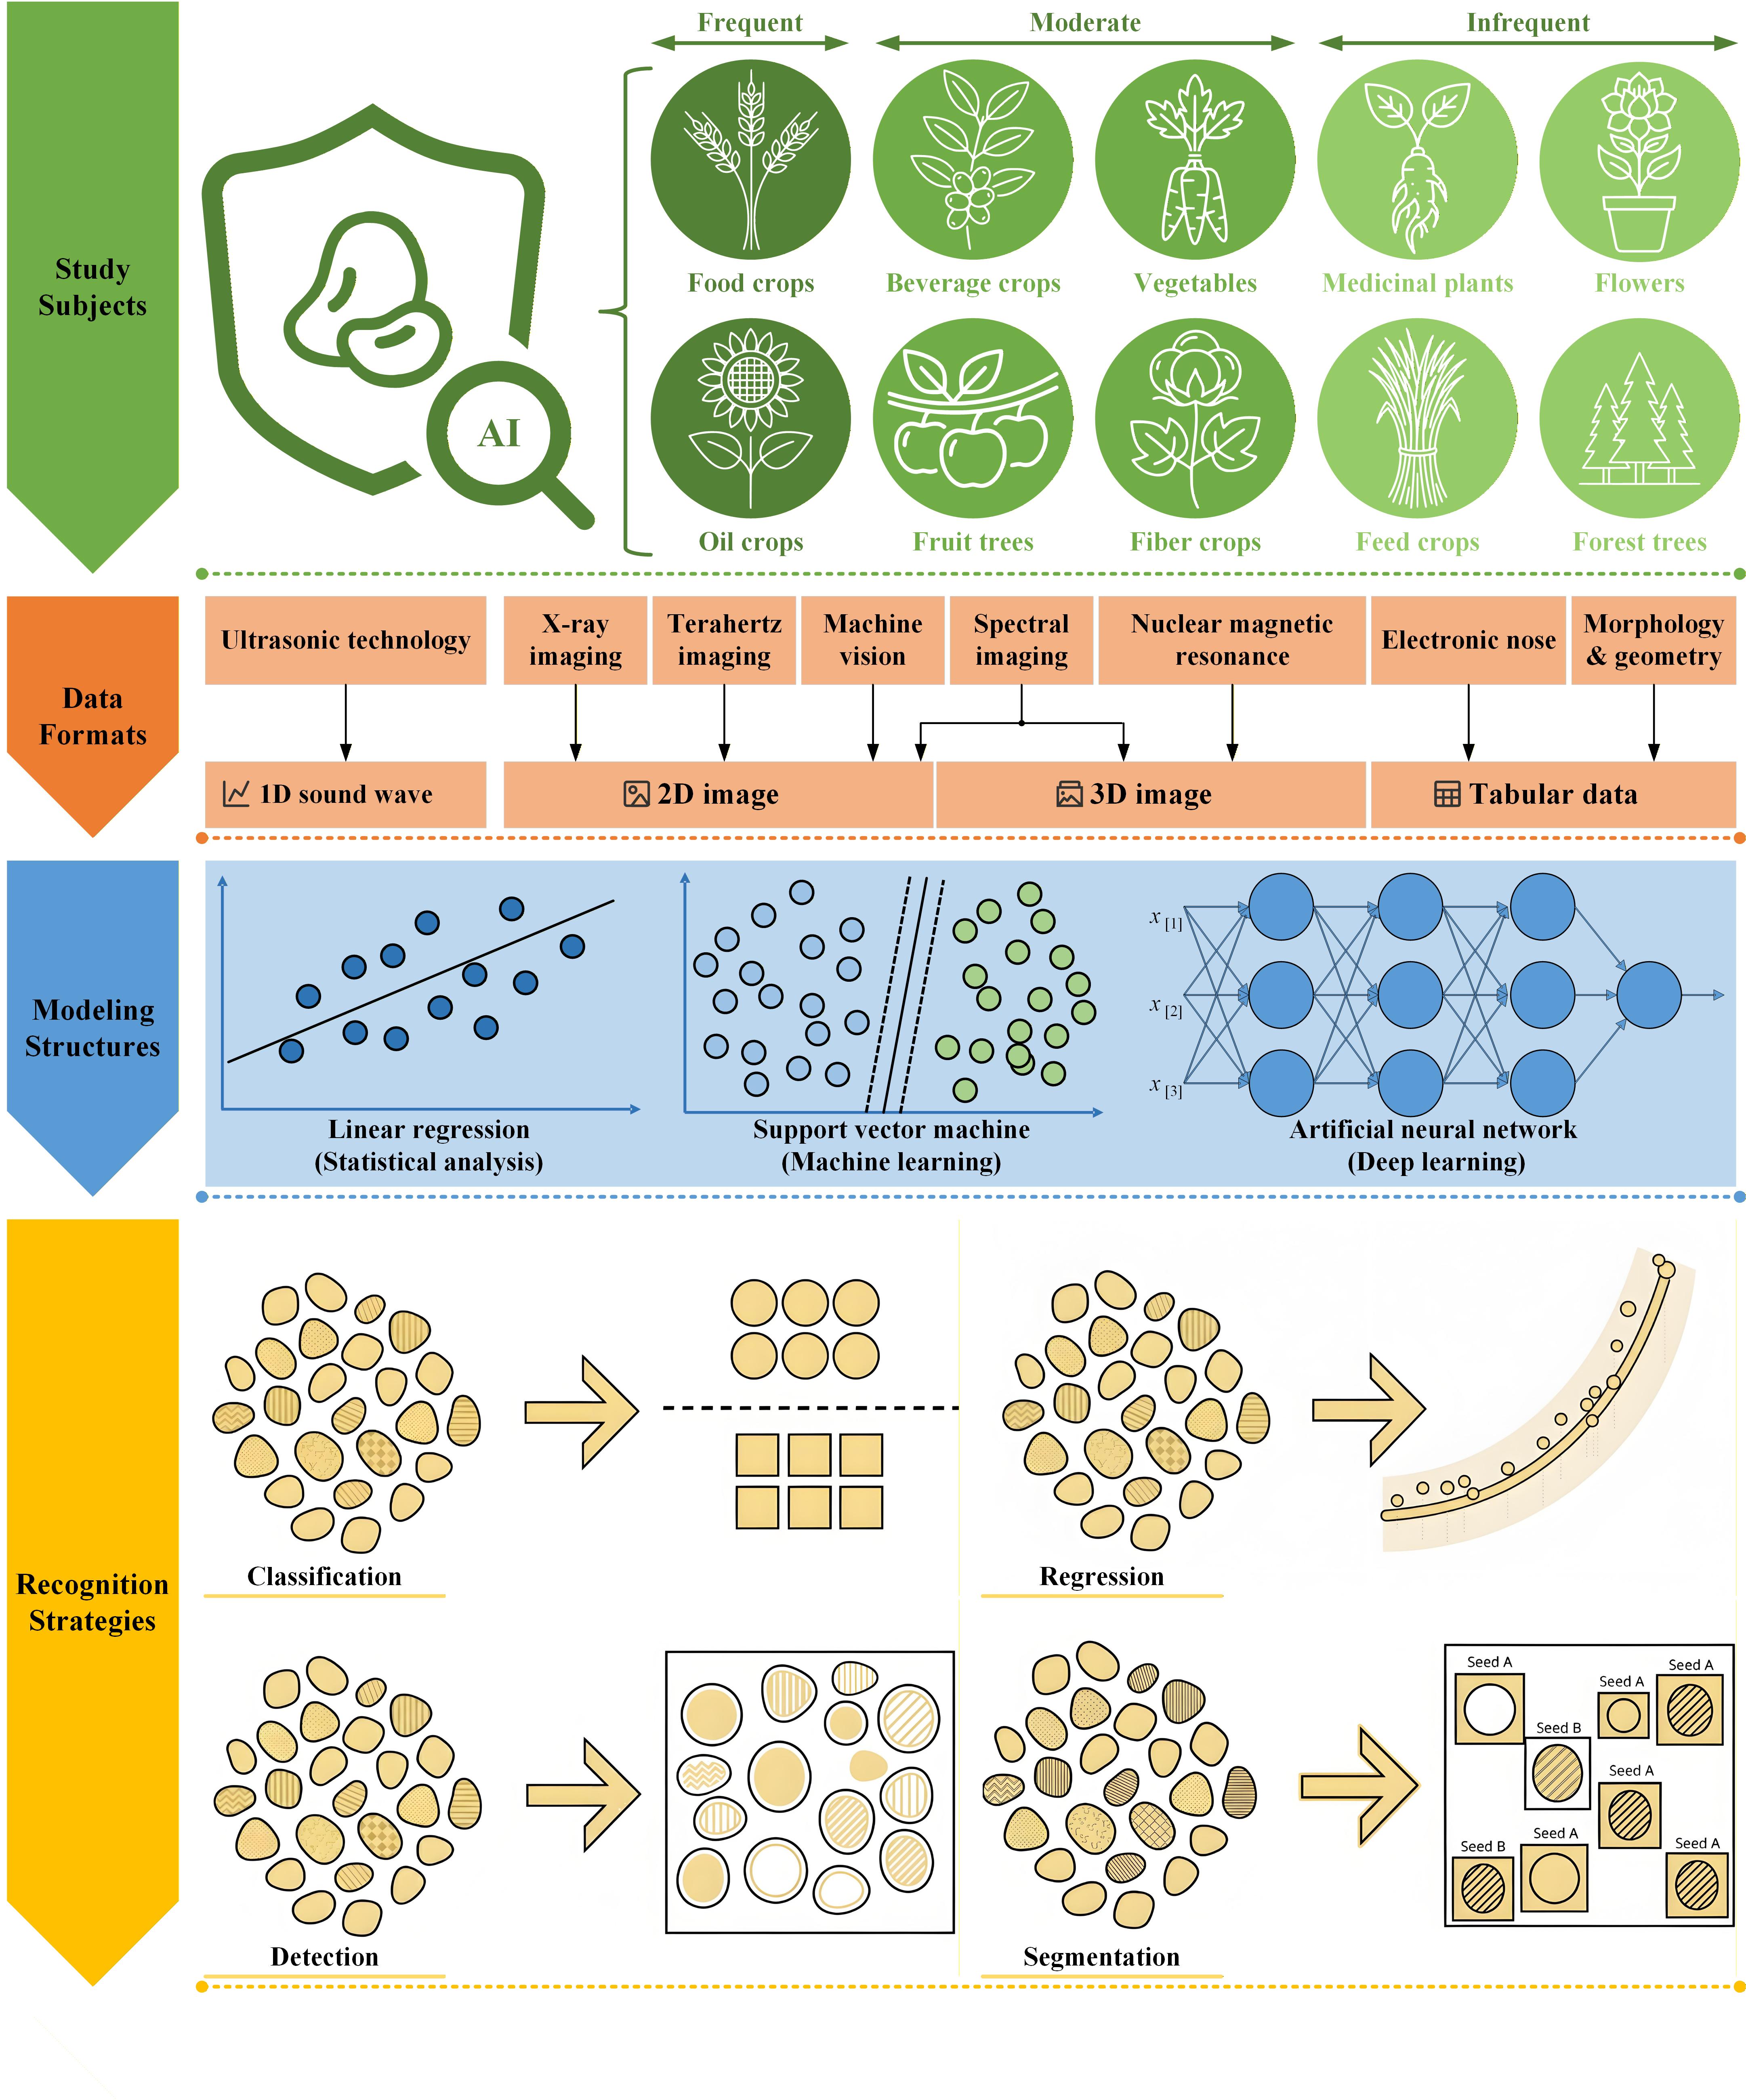
Modern seed non-destructive detection has evolved into a specialized application of AI in seed science. As illustrated in Fig. 1, this technology employs mathematical models to capture complex nonlinear relationships between seed features and target attributes, aligning with AI paradigms widely used in image and speech processing under a unified Input-Model-Output framework:
- Input: Appropriate non-destructive sensing techniques such as machine vision, hyperspectral imaging, or X-ray imaging are selected according to specific detection objectives.
- Model: Serving as the computational core, this module includes methods ranging from statistical analysis to machine learning and deep learning.
- Output: This defines the target quality indicators to be predicted, such as variety classification, purity assessment, and defect identification.
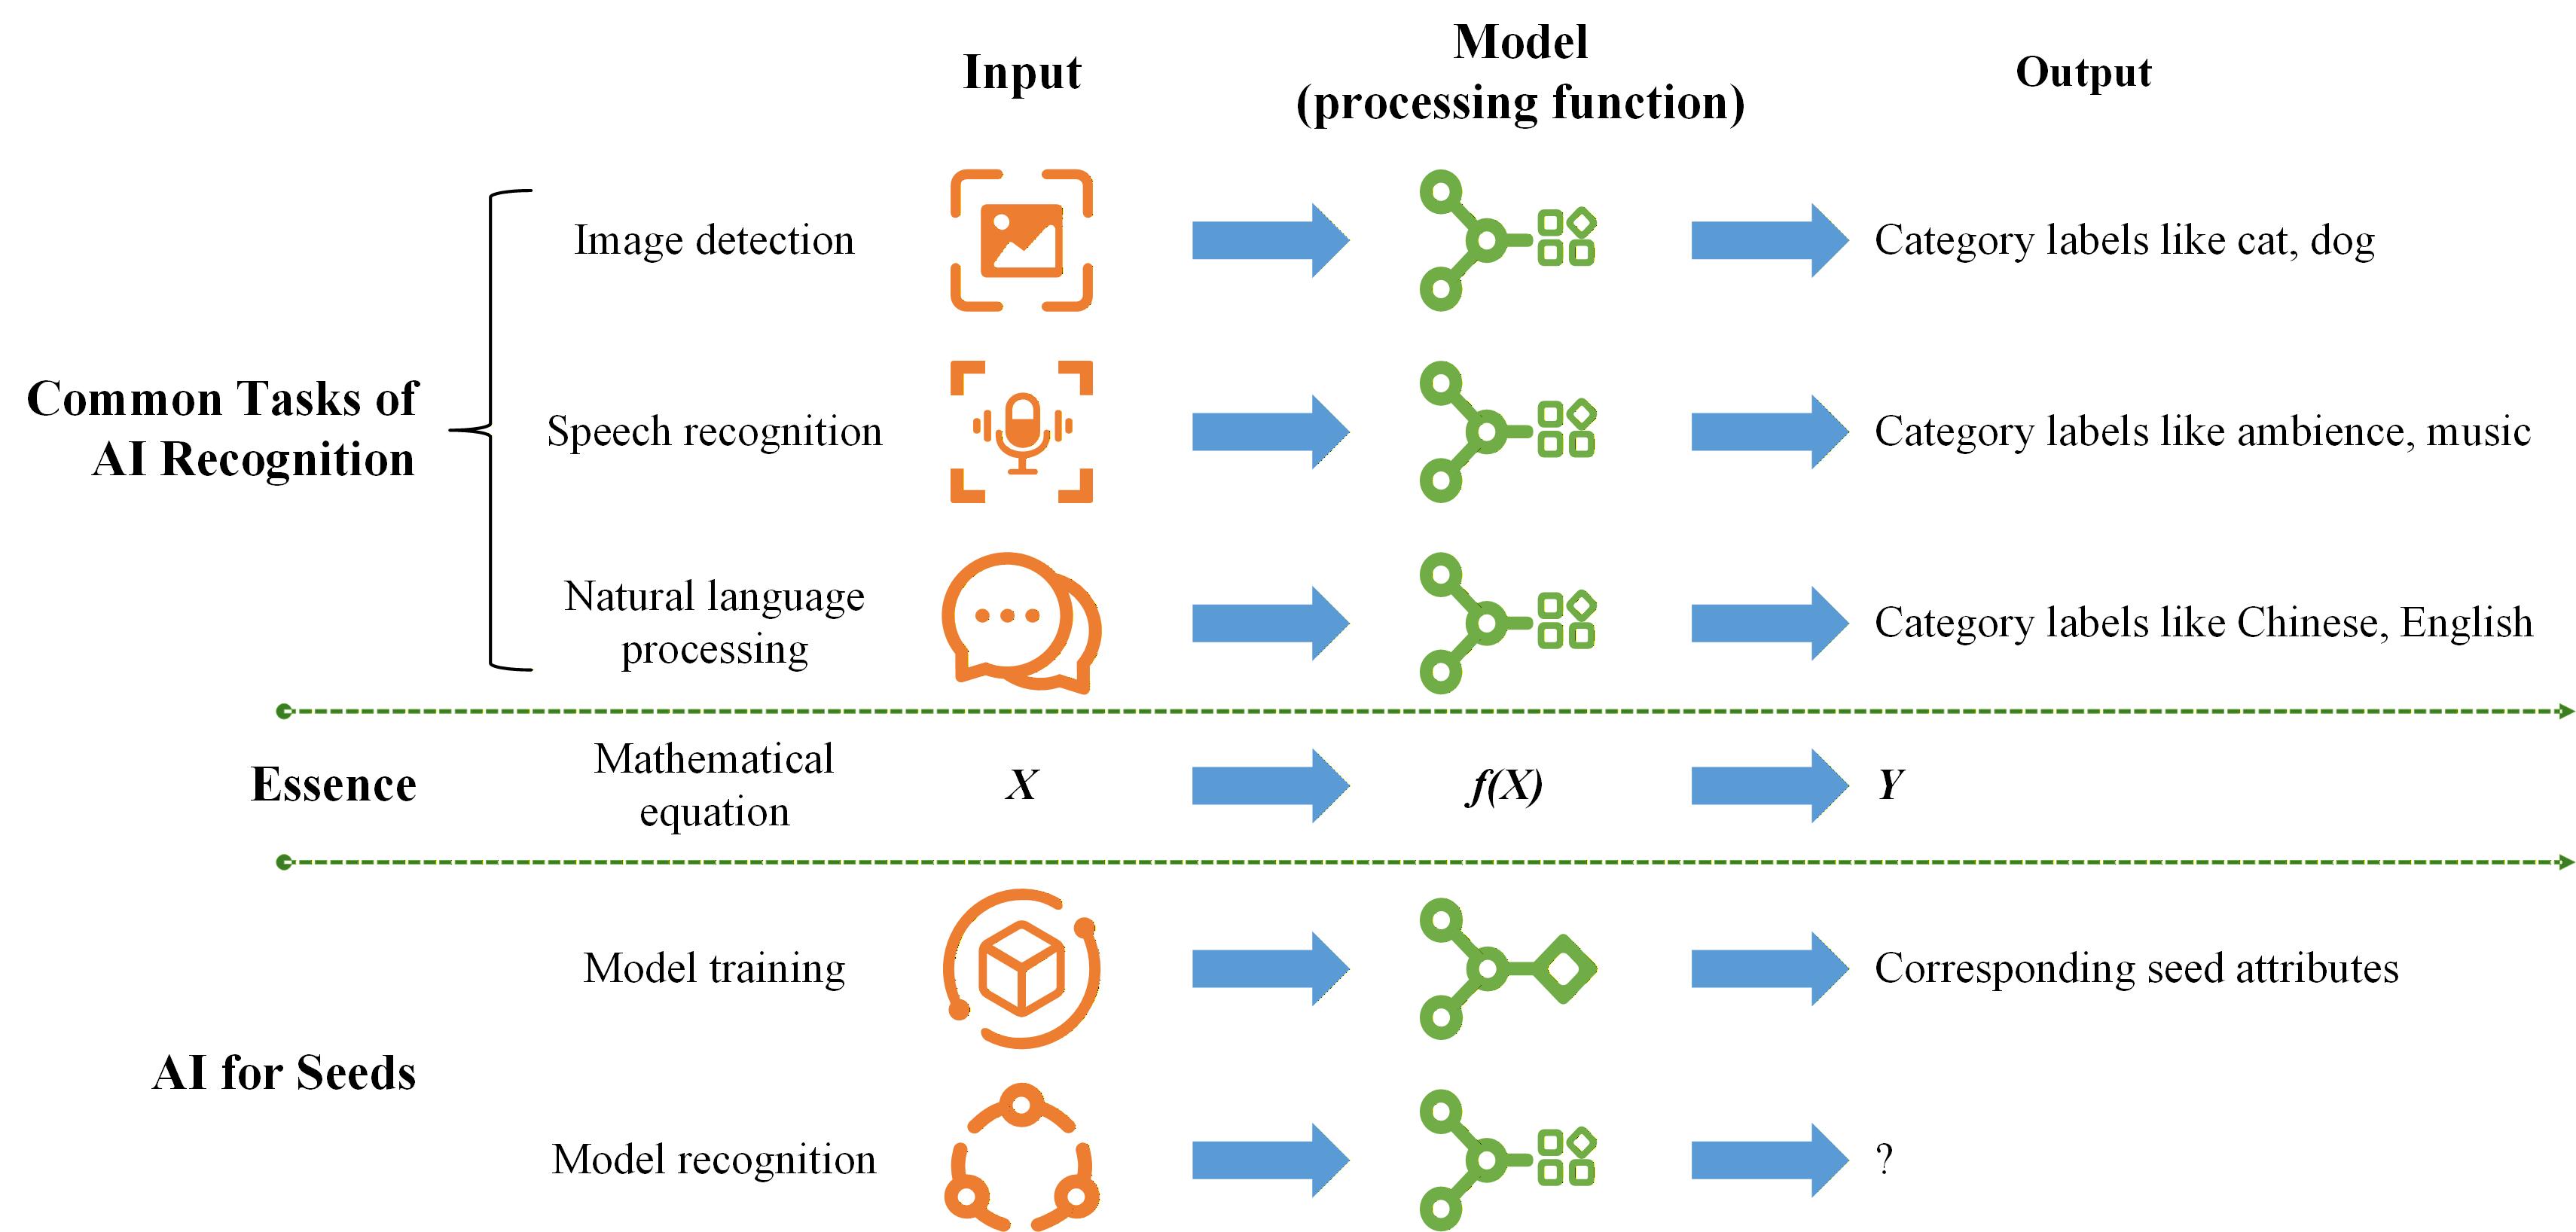
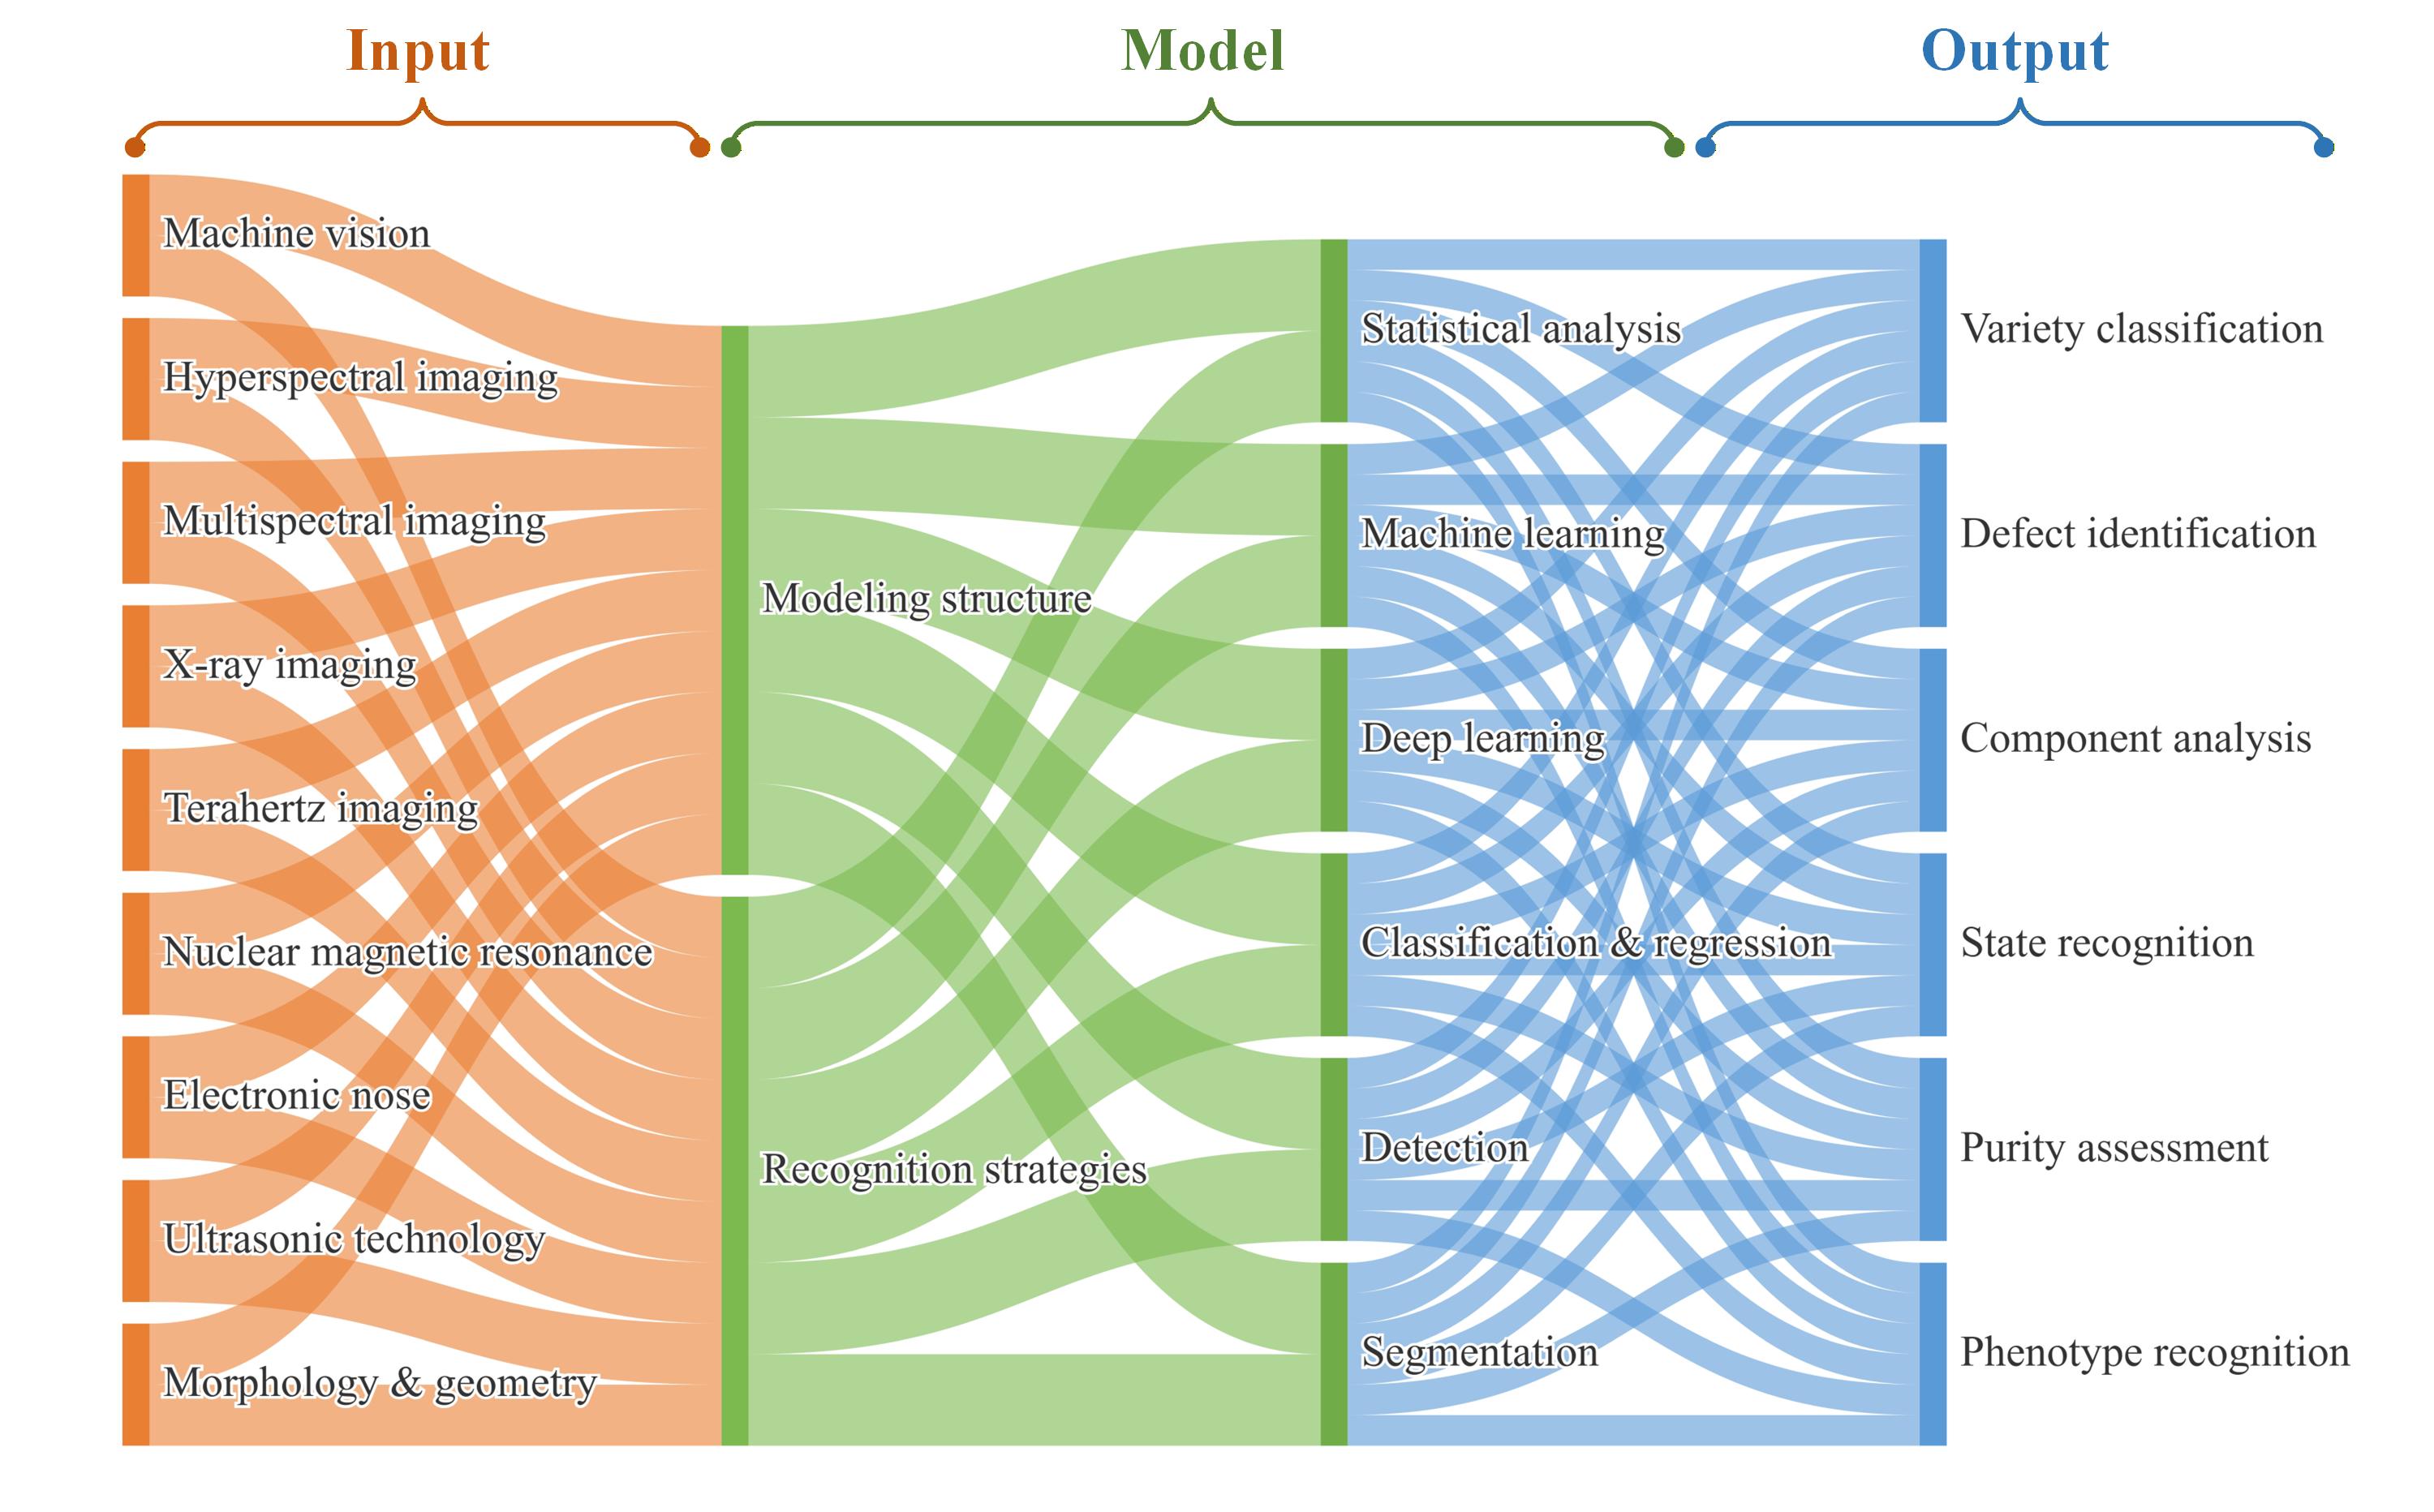
Based on this universal paradigm, Fig. 2 extends the generic pipeline to seed non-destructive detection scenarios, outlining the specific methodologies employed at each stage. By flexibly configuring the input, model, and output modules, researchers can effectively address a wide range of research and application objectives.The remainder of this paper reviews the specific techniques for each of the three modules: input sensing, modeling algorithms, and output detection tasks.
Core Non-Destructive Sensing Methods (The "Inputs")
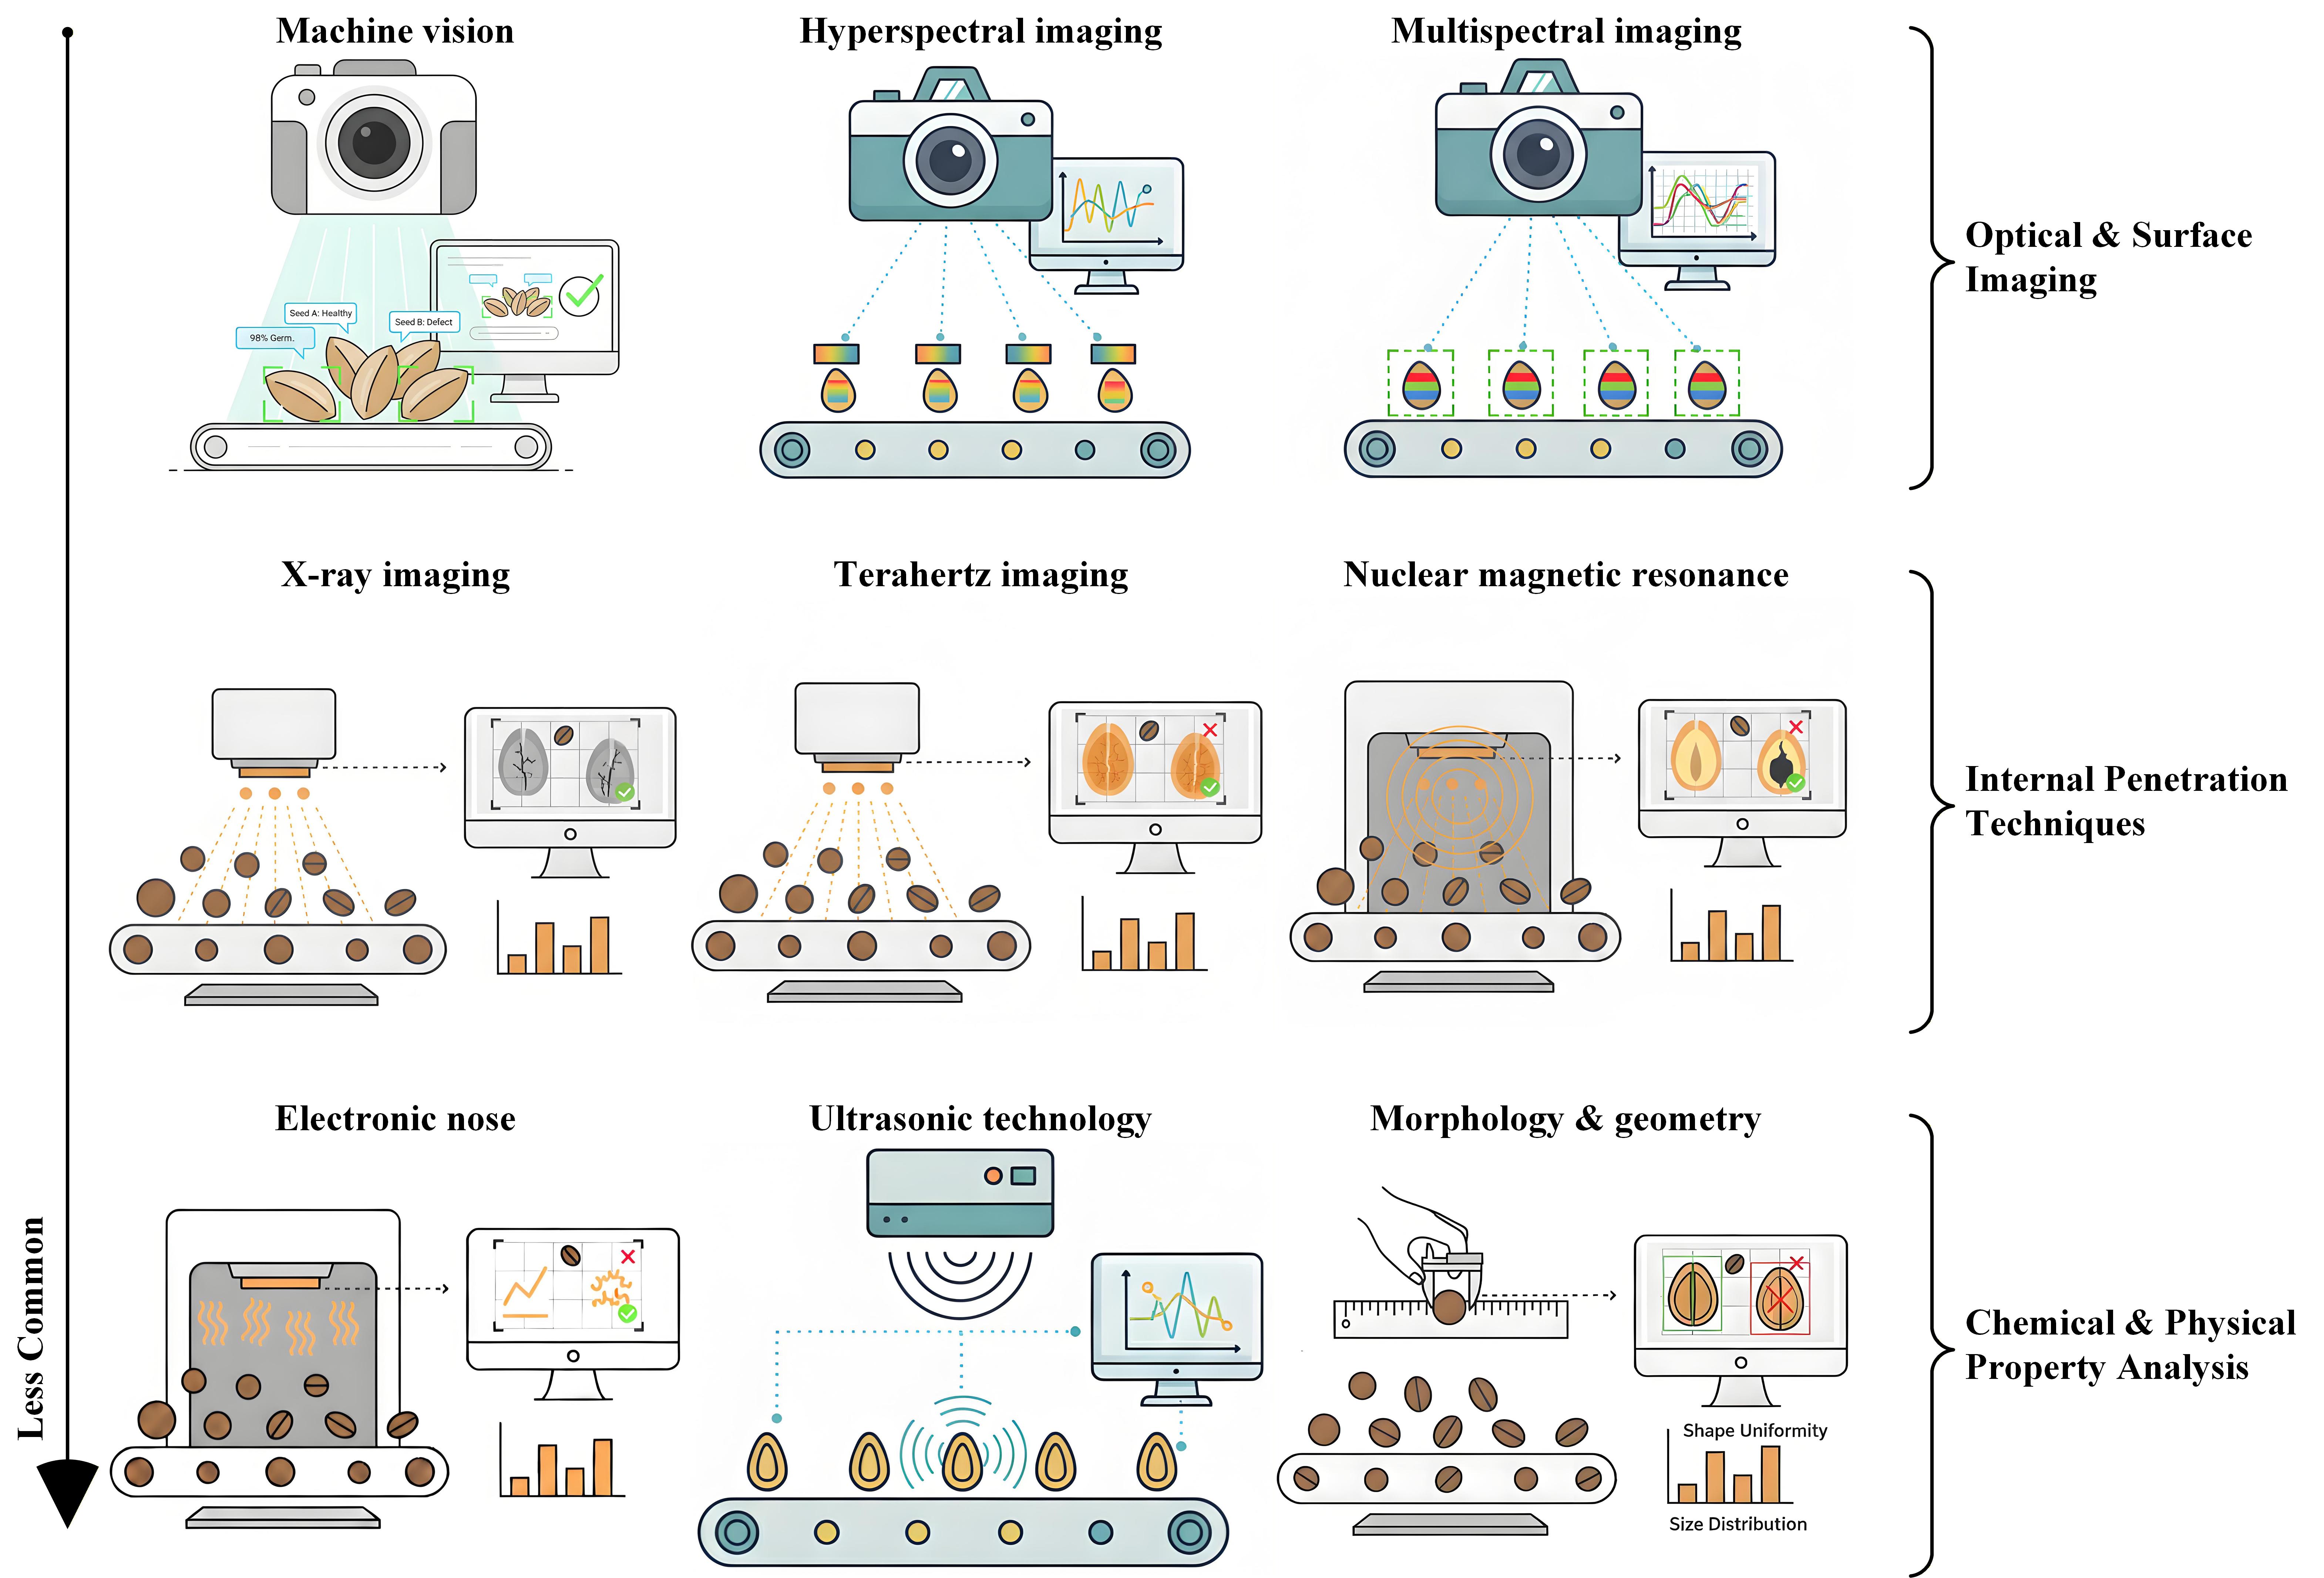
Seed detection methods employ a variety of non-destructive sensing modalities to assess physical, chemical, and physiological characteristics. As shown in Fig. 3, these approaches can be broadly grouped into three categories: optical and surface imaging, internal penetration imaging, and chemical and physical property analysis. The following sections summarize their key advantages, limitations, and application scenarios.
- Machine Vision (RGB): Provides high-speed, low-cost analysis and is effective for extracting surface features such as color, shape, and morphology, but cannot capture internal biochemical information.
- Hyperspectral (HSI) & Multispectral (MSI) Imaging: HSI integrates spatial and continuous spectral information to detect subtle biochemical variations, such as moisture and protein content, but is computationally intensive and costly. MSI offers a faster and more economical alternative by using discrete spectral bands.
- X-Ray Imaging: Enables visualization of internal structures and defects, such as cavities and insect damage, based on density differences; however, it involves radiation risks and relatively high equipment costs.
- Terahertz (THz) & Nuclear Magnetic Resonance (NMR): THz imaging is highly sensitive to moisture and structural properties, while NMR provides proton distribution mapping for precise oil and water quantification. Both methods are currently constrained by high cost and low throughput.
- Other Methods: Electronic noses (E-Nose) and ultrasonic techniques are also employed for spoilage detection and internal defect evaluation, respectively, among other emerging approaches.
AI Processing Algorithms & Strategies (The "Models")
Fig. 4 illustrates a wide spectrum of modeling architectures, ranging from classical Linear Regression and representative machine learning methods such as Support Vector Machines, to deep learning frameworks like Artificial Neural Networks with their advanced hierarchical processing.
These models transform raw sensor data into actionable insights through three progressive stages:
- Statistical Analysis: methods such as partial least squares discriminant analysis offer high interpretability and efficiency on small datasets.
- Classical Machine Learning (ML): support vector machines and random forests balance computational efficiency with strong performance on structured data.
- Deep Learning (DL): Convolutional Neural Networks and Vision Transformers represent the state of the art, automatically extracting hierarchical features from raw images and spectral data.
As for recognition strategies, the same underlying model can be adapted for classification (e.g., variety or status categorization), regression (e.g., moisture or vigor estimation), detection (e.g., defect or wormhole localization), and segmentation (e.g., individual seed isolation and defect region delineation).
Primary Applications (The "Outputs")
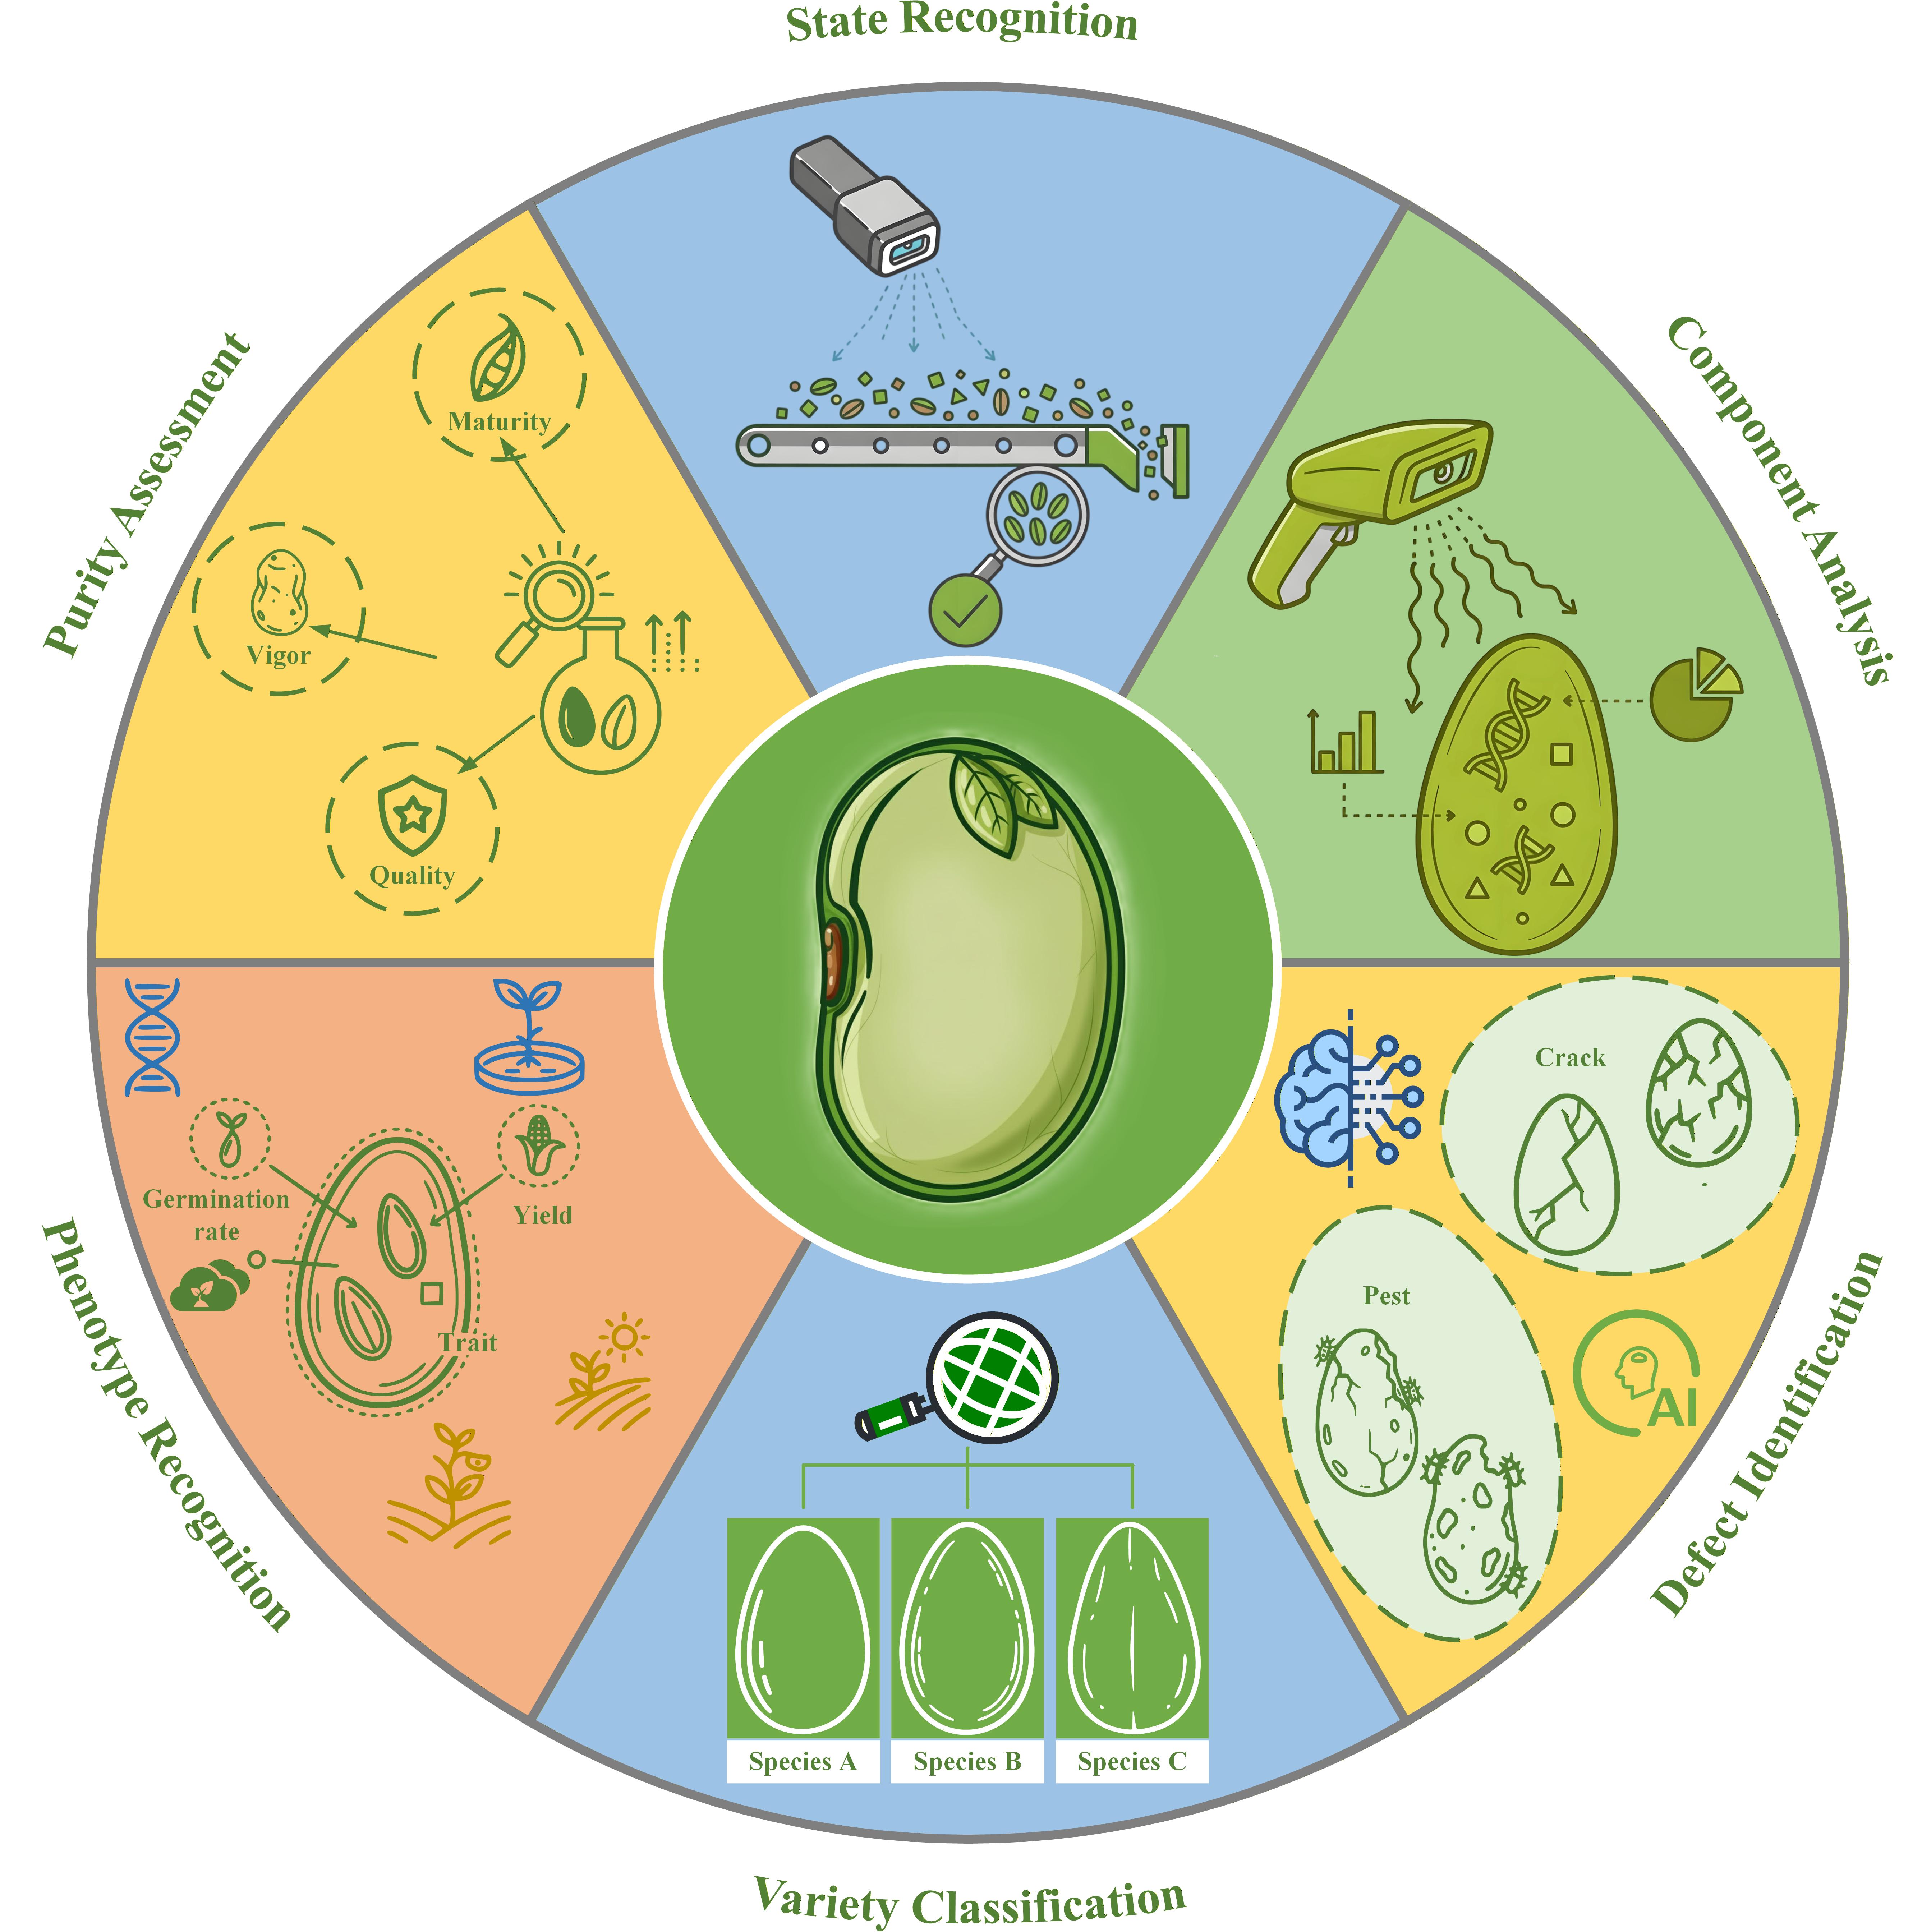
The output component represents the final critical stage in seed non-destructive detection, transforming input data and model results into actionable, quantifiable metrics. These outputs enable a non-destructive characterization of seed attributes, yielding interpretable and reliable results that align with agricultural and industrial standards. Acting as critical performance indicators, the output metrics bridge model predictions and practical applications, providing domain-specific insights in key areas such as variety classification, defect identification, component analysis, state recognition, purity assessment, and phenotypic recognition (Fig. 5).
3 Research Progress and Bibliometric Analysis
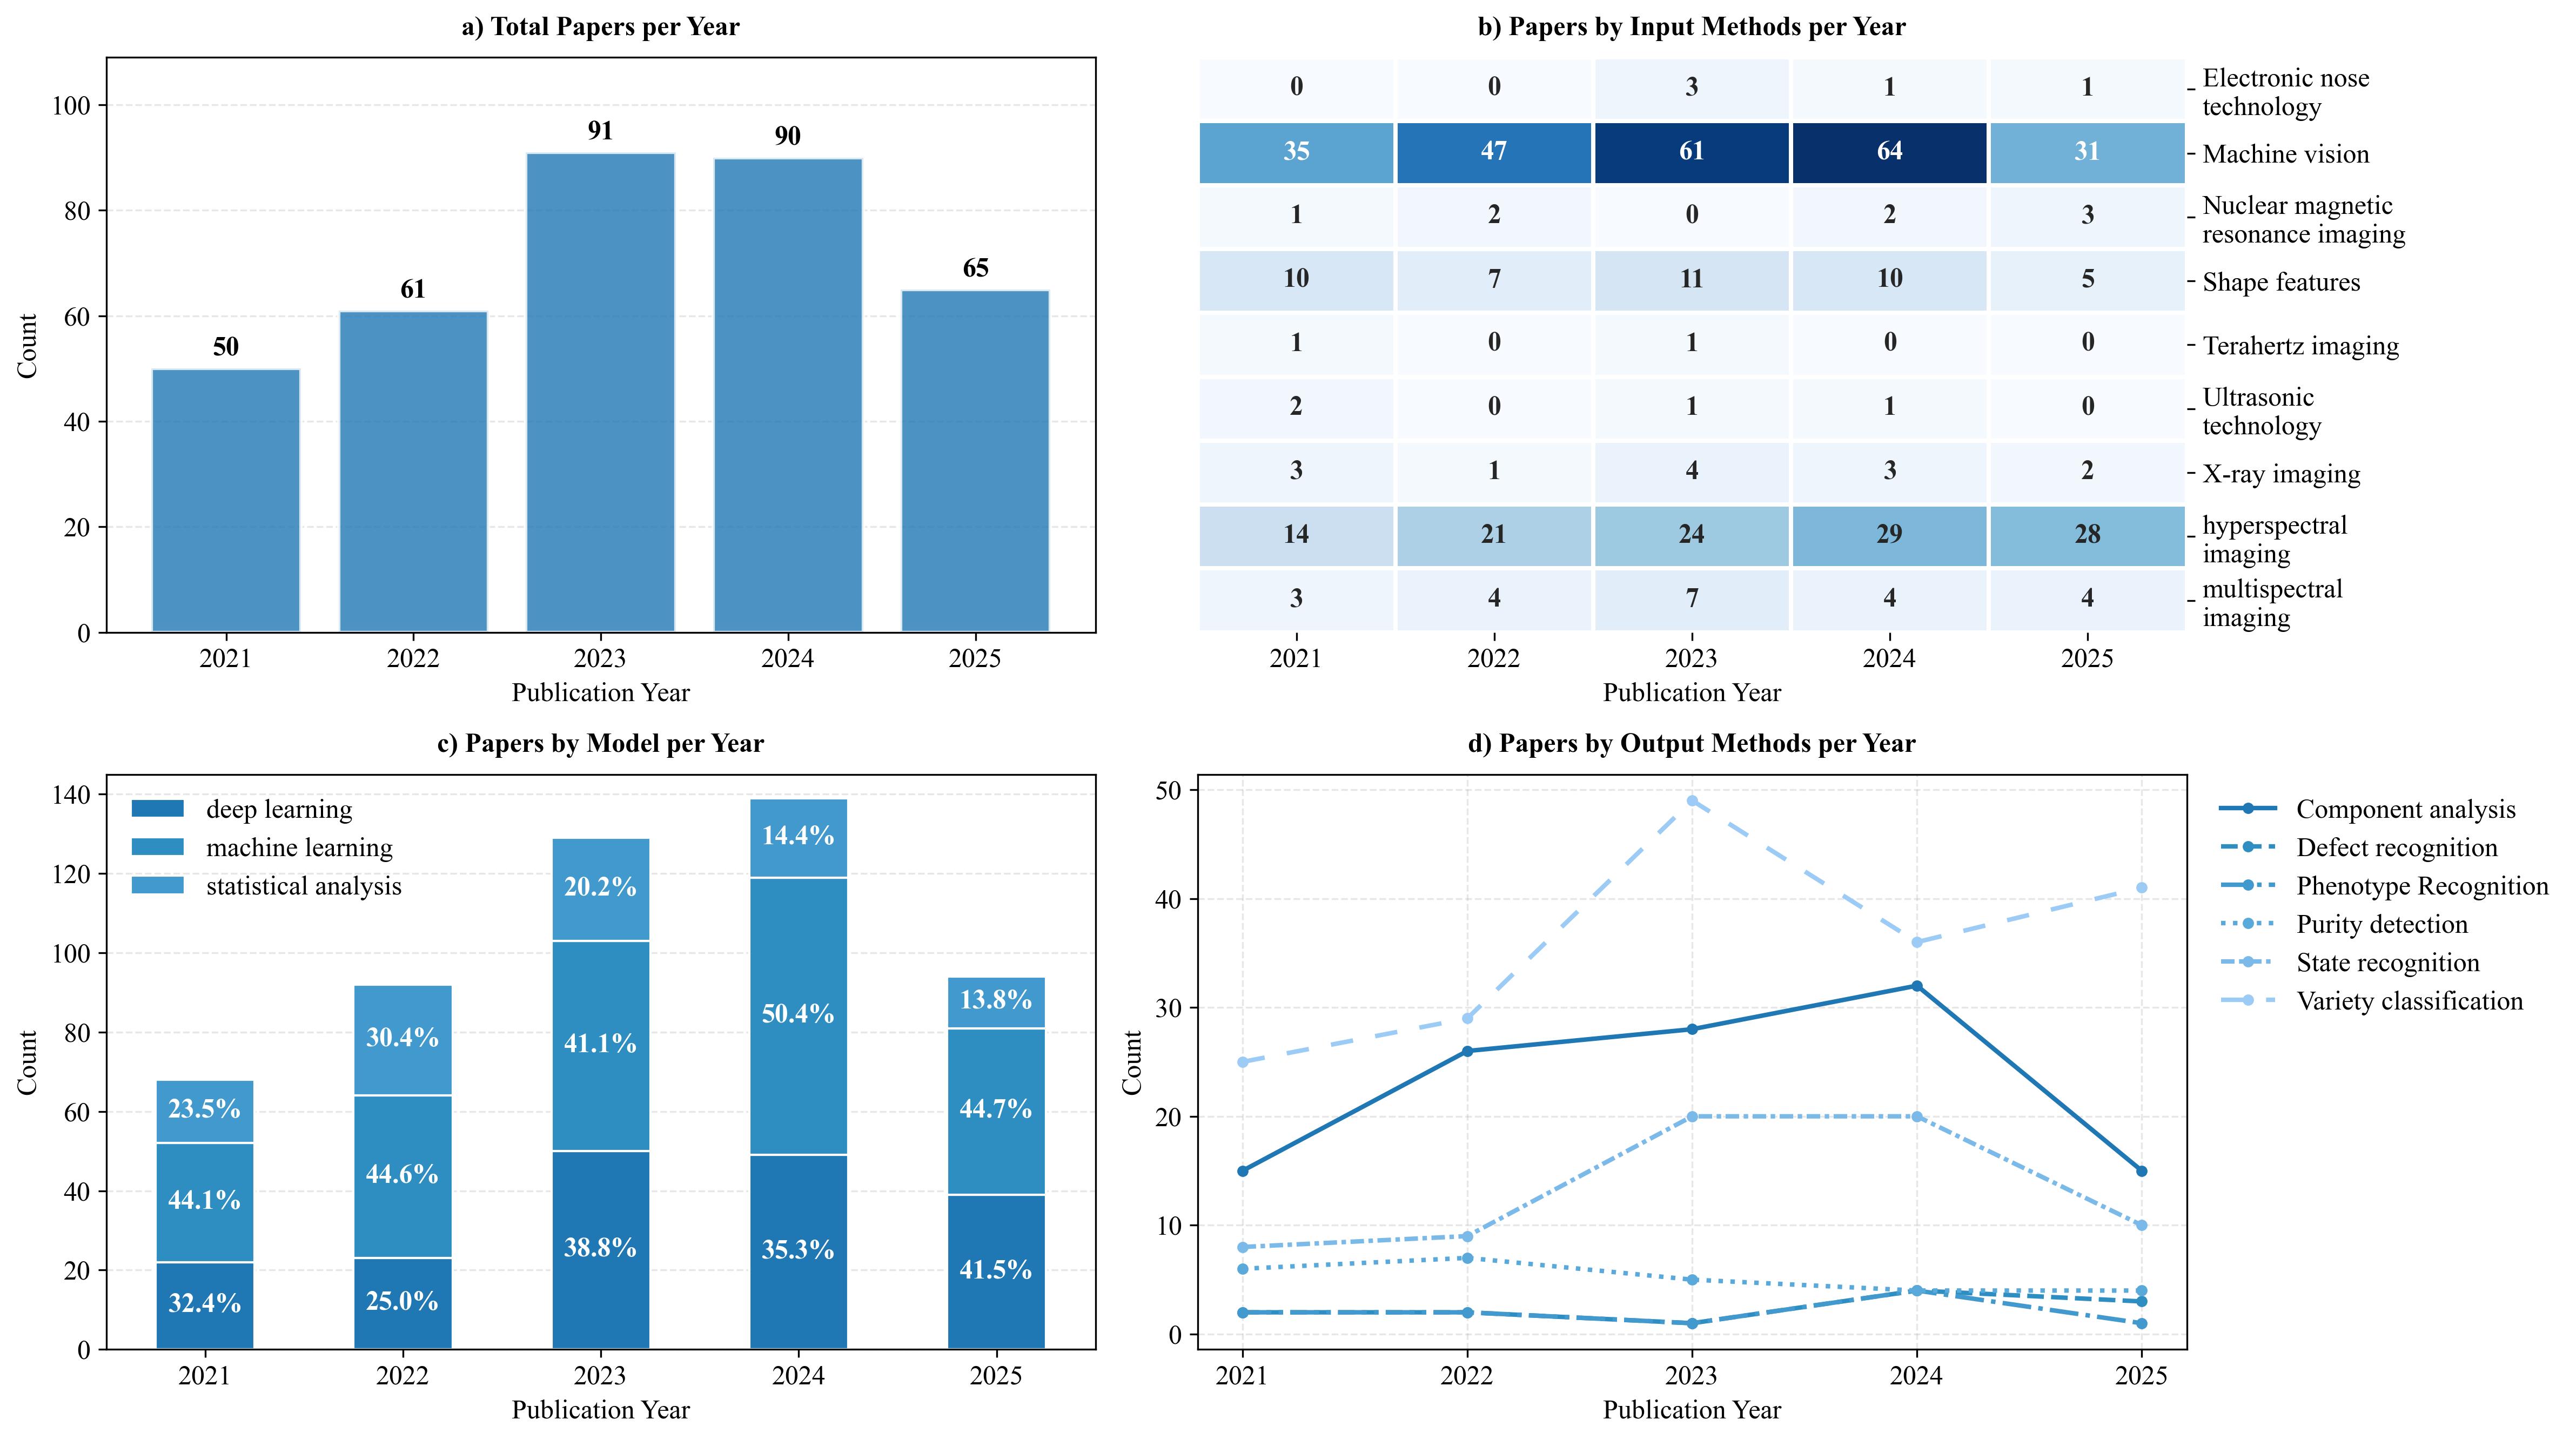
From 2021 to 2025, research on seed non-destructive detection has shown steady growth. As shown in Fig. 6, the field is characterized by three main aspects:
Sensing modalities: Machine vision and hyperspectral imaging remain the dominant approaches. The former is widely used due to its low cost and ease of acquisition but is mainly limited to surface features, while the latter enables internal quality analysis such as chemical composition and physiological traits.
Modeling strategies: Traditional machine learning and deep learning develop in parallel without clear dominance. This balance is mainly driven by limited dataset sizes, which constrain data-intensive methods and sustain the relevance of classical approaches.
Application tasks: Research is mainly concentrated on variety classification, which relies on stable visual and spectral features, whereas phenotype and state recognition remain less explored due to higher data and experimental requirements.
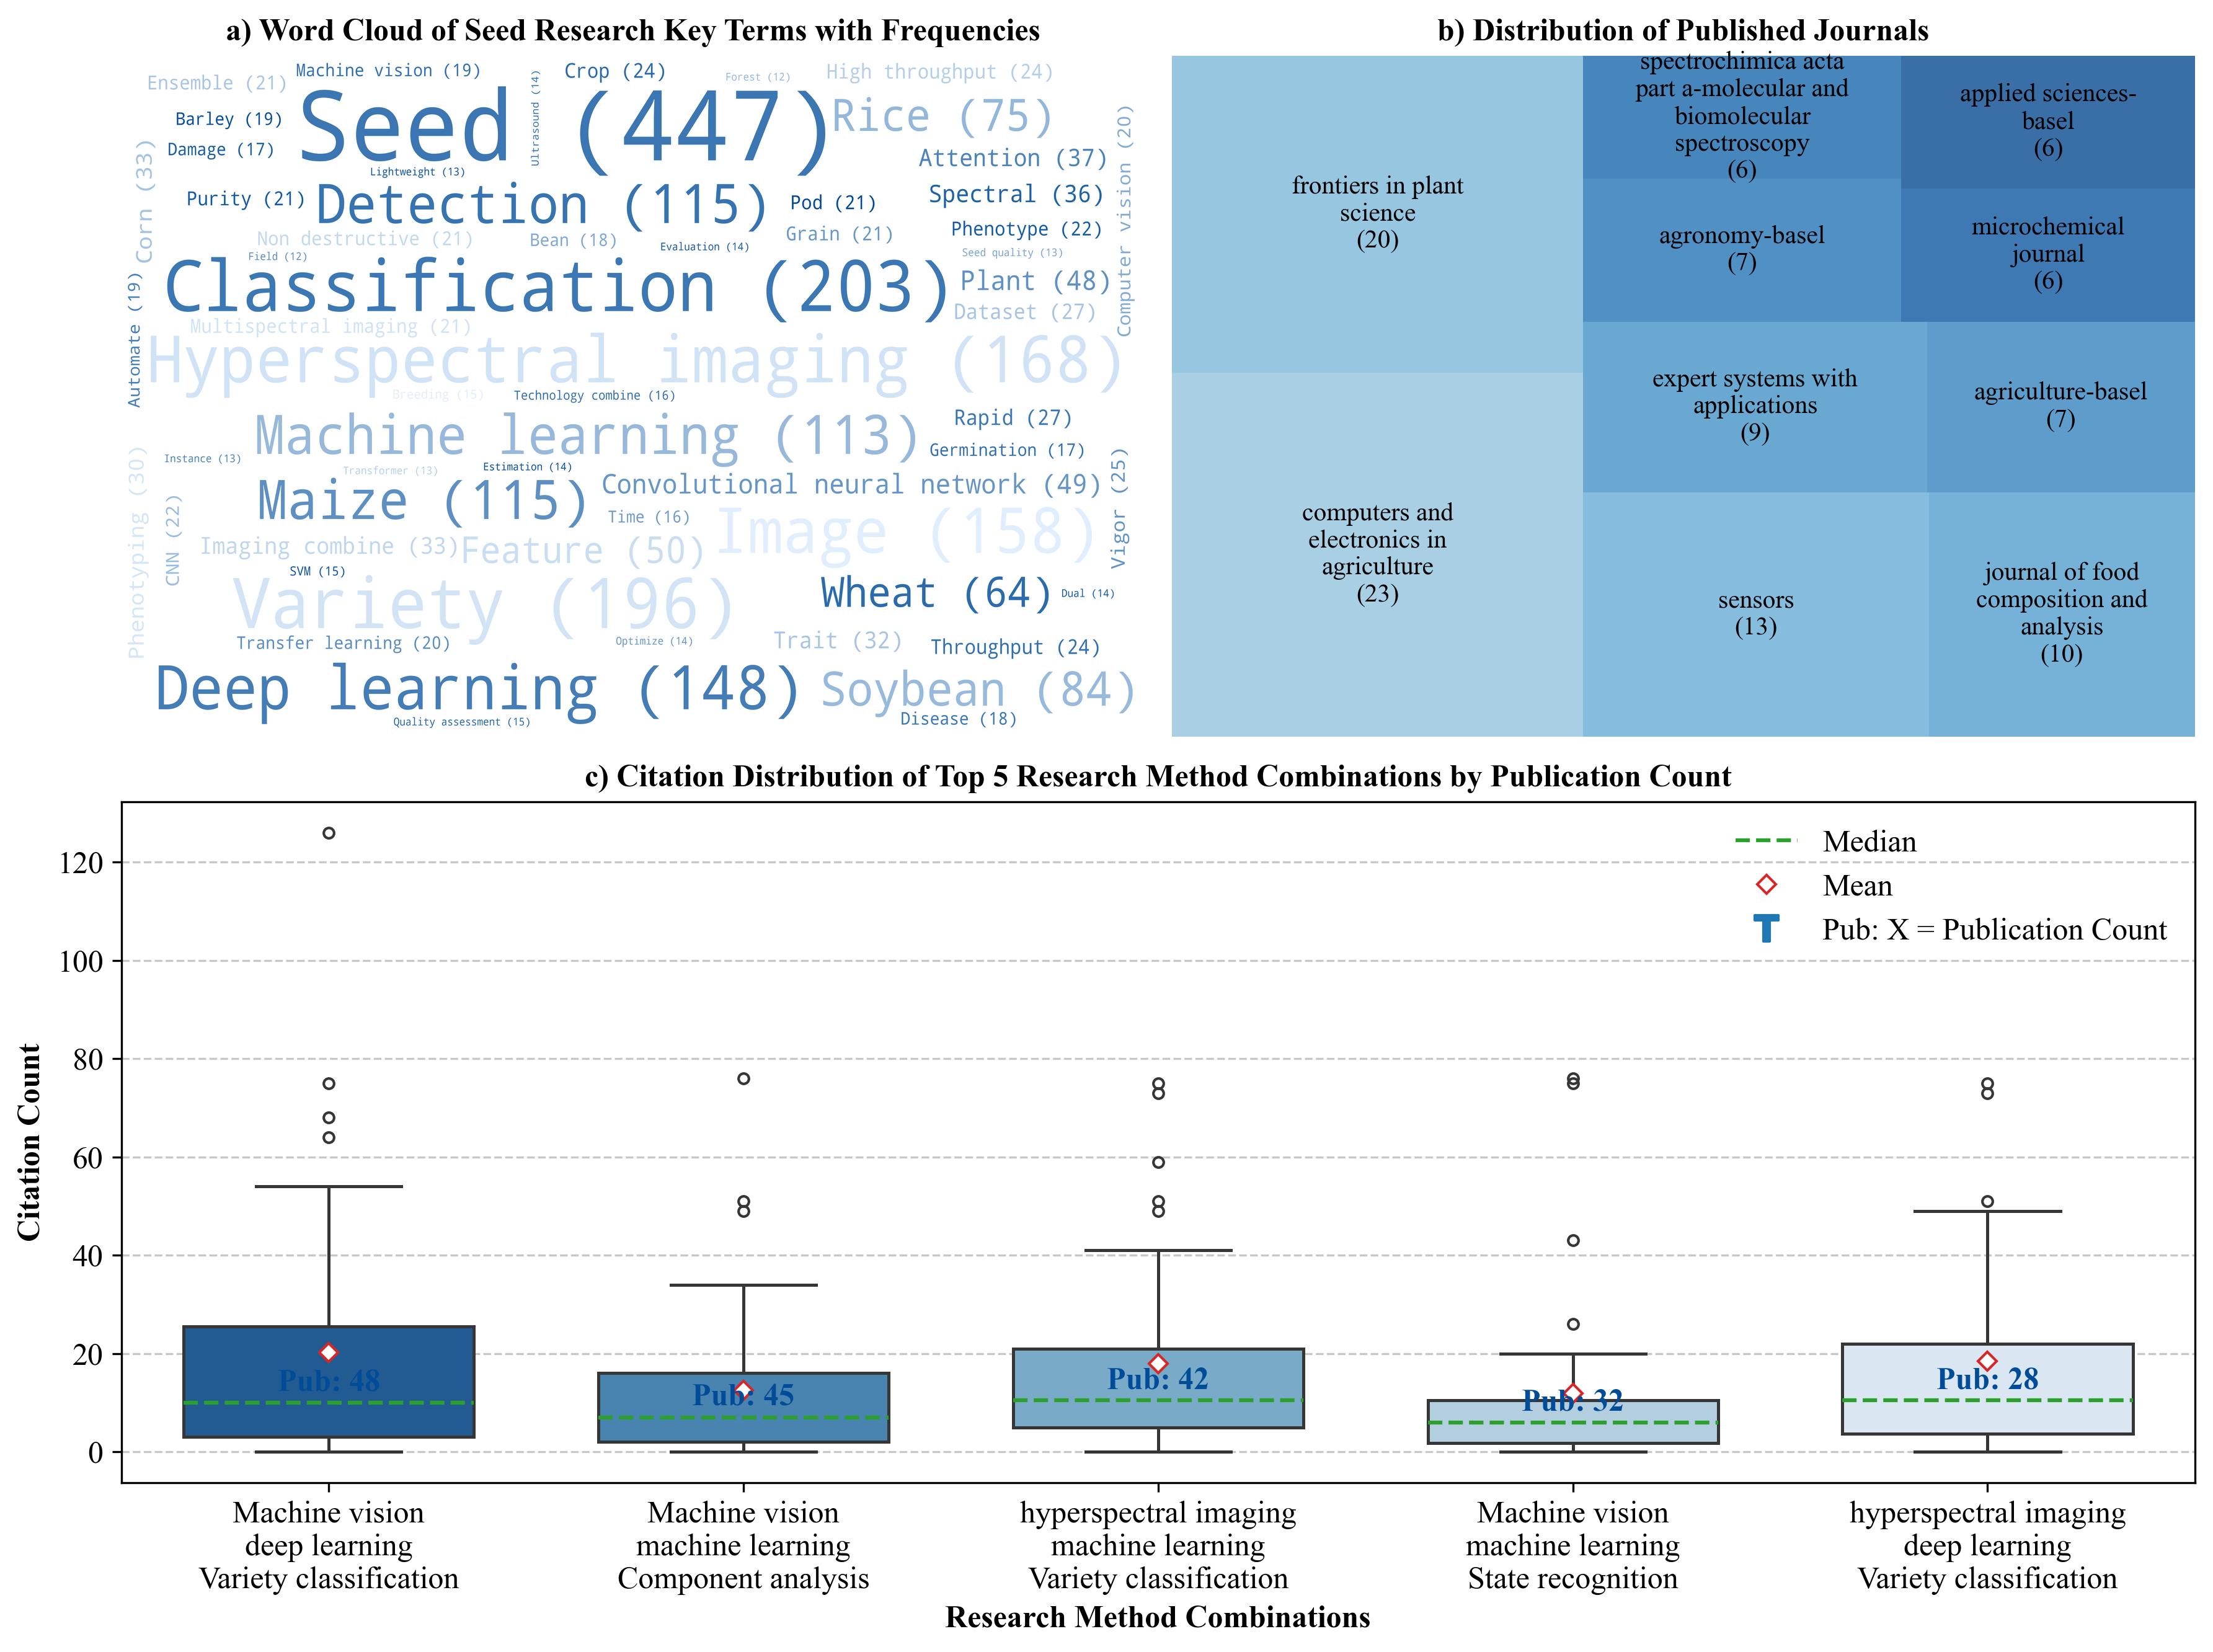
The knowledge structure from keyword and citation analyses further supports these trends (Fig. 7). Keywords are dominated by “seed,” “classification,” and “deep learning,” while emerging terms such as “attention” and “phenotype” indicate a gradual shift toward more complex and biologically informed modeling. The literature is highly interdisciplinary, spanning agriculture, spectroscopy, and computer science, and increasingly driven by data-centric approaches.
Citation patterns show that machine vision combined with machine learning remains the most established framework for classification tasks. Hyperspectral imaging and deep learning-based methods, however, tend to achieve higher academic impact. This suggests a persistent focus on classification, while internal quality analysis remains relatively limited, with influence concentrated in a small number of studies.
Highly cited studies reveal three consistent directions: generative AI for data augmentation, multimodal fusion of imaging techniques, and continued emphasis on classification-oriented tasks. A key limitation across studies is the lack of standardized benchmark datasets, which restricts cross-study comparison and broader methodological development.
Among these, the most critical limitation across studies is the lack of standardized benchmark datasets, which restricts cross-study comparison and broader methodological development. Table 4 of the original paper catalogs public seed datasets from 2018 to 2025, most of which contain fewer than 10,000 samples, focus on major staples like rice and maize, and lack consistent annotation protocols, further supporting this concern and confirming that the field still lacks the large-scale, multi-species benchmarks needed for robust algorithm development and reproducible evaluation, with the table content as shown below:
| Year | Plant type | Input | Model | Output | Direct download | Dataset scale | Cite |
|---|---|---|---|---|---|---|---|
| 2018 | Barley | Tabular | Statistical | Phenotype Recognition | Y | - | Gonzalez et al., 2018 |
| 2019 | Maize | Image | DL (Classification) | Defect Identification | Y | 5 categories, 3000 samples | Bhurtel et al., 2019 |
| 2019 | Plants | Tabular | Statistical | Phenotype Recognition | Y | 3 features, 24,208 samples | Ganhao and Dias, 2019 |
| 2019 | Maize | Image | DL (Classification) | Variety Classification | Y | 2 categories, 3000 samples | Altuntaş et al., 2019 |
| 2019 | Rice | Image + Hyperspectral | ML (Classification) | Variety Classification | Y | 90 categories, 8640 samples | Vu et al., 2019 |
| 2020 | Barley | Image | DL (Segmentation) | Phenotype Recognition | N | 1200 samples | Toda et al., 2020 |
| 2020 | Sugar beet | Tabular | - | Phenotype Recognition | Y | 28 features | Ducournau et al., 2020 |
| 2020 | Dry beans | Image | ML (Classification) | Variety Classification | Y | 7 categories, 13,611 samples | Koklu and Ozkan, 2020 |
| 2020 | Rice | Hyperspectral Image | ML (Classification) | Variety Classification | N | 10 categories, 4320 samples | Weng et al., 2020 |
| 2021 | Pumpkin | Image | ML (Classification) | Variety Classification | Y | 2 categories, 2500 samples | Koklu et al., 2021b |
| 2023 | Cannabis | Image | - | Variety Classification | Y | 17 categories, 3,434 samples | Chumchu and Patil, 2023 |
| 2023 | Soybean | Image | - | Defect Identification | Y | 5 categories, 5,513 samples | Lin et al., 2023 |
| 2024 | Rice | Image | ML (Classification) | Variety Classification | Y | 5 categories, 4,748 samples | Din et al., 2024 |
| 2024 | Plants | Image | DL (Classification) | Variety Classification | Y | 88 categories, 4,496 samples | Yuan et al., 2024 |
| 2024 | Soybean | Image | DL (Classification) | Defect Identification | Y | 7 categories, 4,830 samples | Pereira and Foleis, 2024 |
| 2024 | Maize | Image | DL (Detection) | State Recognition | Y | 5 categories, 19,800 samples | Chen et al., 2024 |
| 2024 | Crop | Image | DL (Detection) | Variety Classification | Y | 6 categories, 376 samples | Pun et al., 2024 |
| 2024 | Rice | Hyperspectral Image | ML (Classification) | Variety Classification | Y | 6 categories, 60,000 samples | Ge et al., 2024 |
| 2025 | Plants | Image + Hyperspectral | DL (Classification) | Variety Classification | Y | 10 categories, 10,000 images | Kukushkin et al., 2025 |
| 2025 | Wheat | Image | - | Variety Classification | Y | 3 categories, 375 images | Nawaz et al., 2025 |
| 2025 | Wheat | Image | DL (Classification) | Variety Classification | Y | 5 categories, 5,004 images | Guo et al., 2025 |
Note
In seed non-destructive intelligent detection, despite high reported accuracies, practical performance remains limited due to a mismatch between laboratory conditions and real industrial environments. Datasets remain small, crop-biased, and inconsistently annotated, while real-world factors such as motion blur, seed overlap, and unstable imaging are rarely reflected in experiments, leading to inflated performance expectations. In addition, artificially prepared samples fail to capture natural biological variation, so most reported gains remain confined to controlled settings. Closing this gap requires a shift from algorithm-centric optimization toward system-level development with more representative data, reliable evaluation protocols, and stronger integration of domain knowledge.